data-projects
A list of projects related to data
This is a selection of projects I’ve worked on in the past related to data. The images link to the project sites. Note that this only includes public projects. A good, general thought piece of mine is Data as culture: how will we live in a data driven society?
Table of Contents
- Show me the money, a data project
- How open data can help shape the way we analyse electoral behaviour, another data project
- What is a CSV? A case study of CSVs on data.gov.uk, an elaborate blog post
- A survey of the uses in quantified self, a survey and presentation
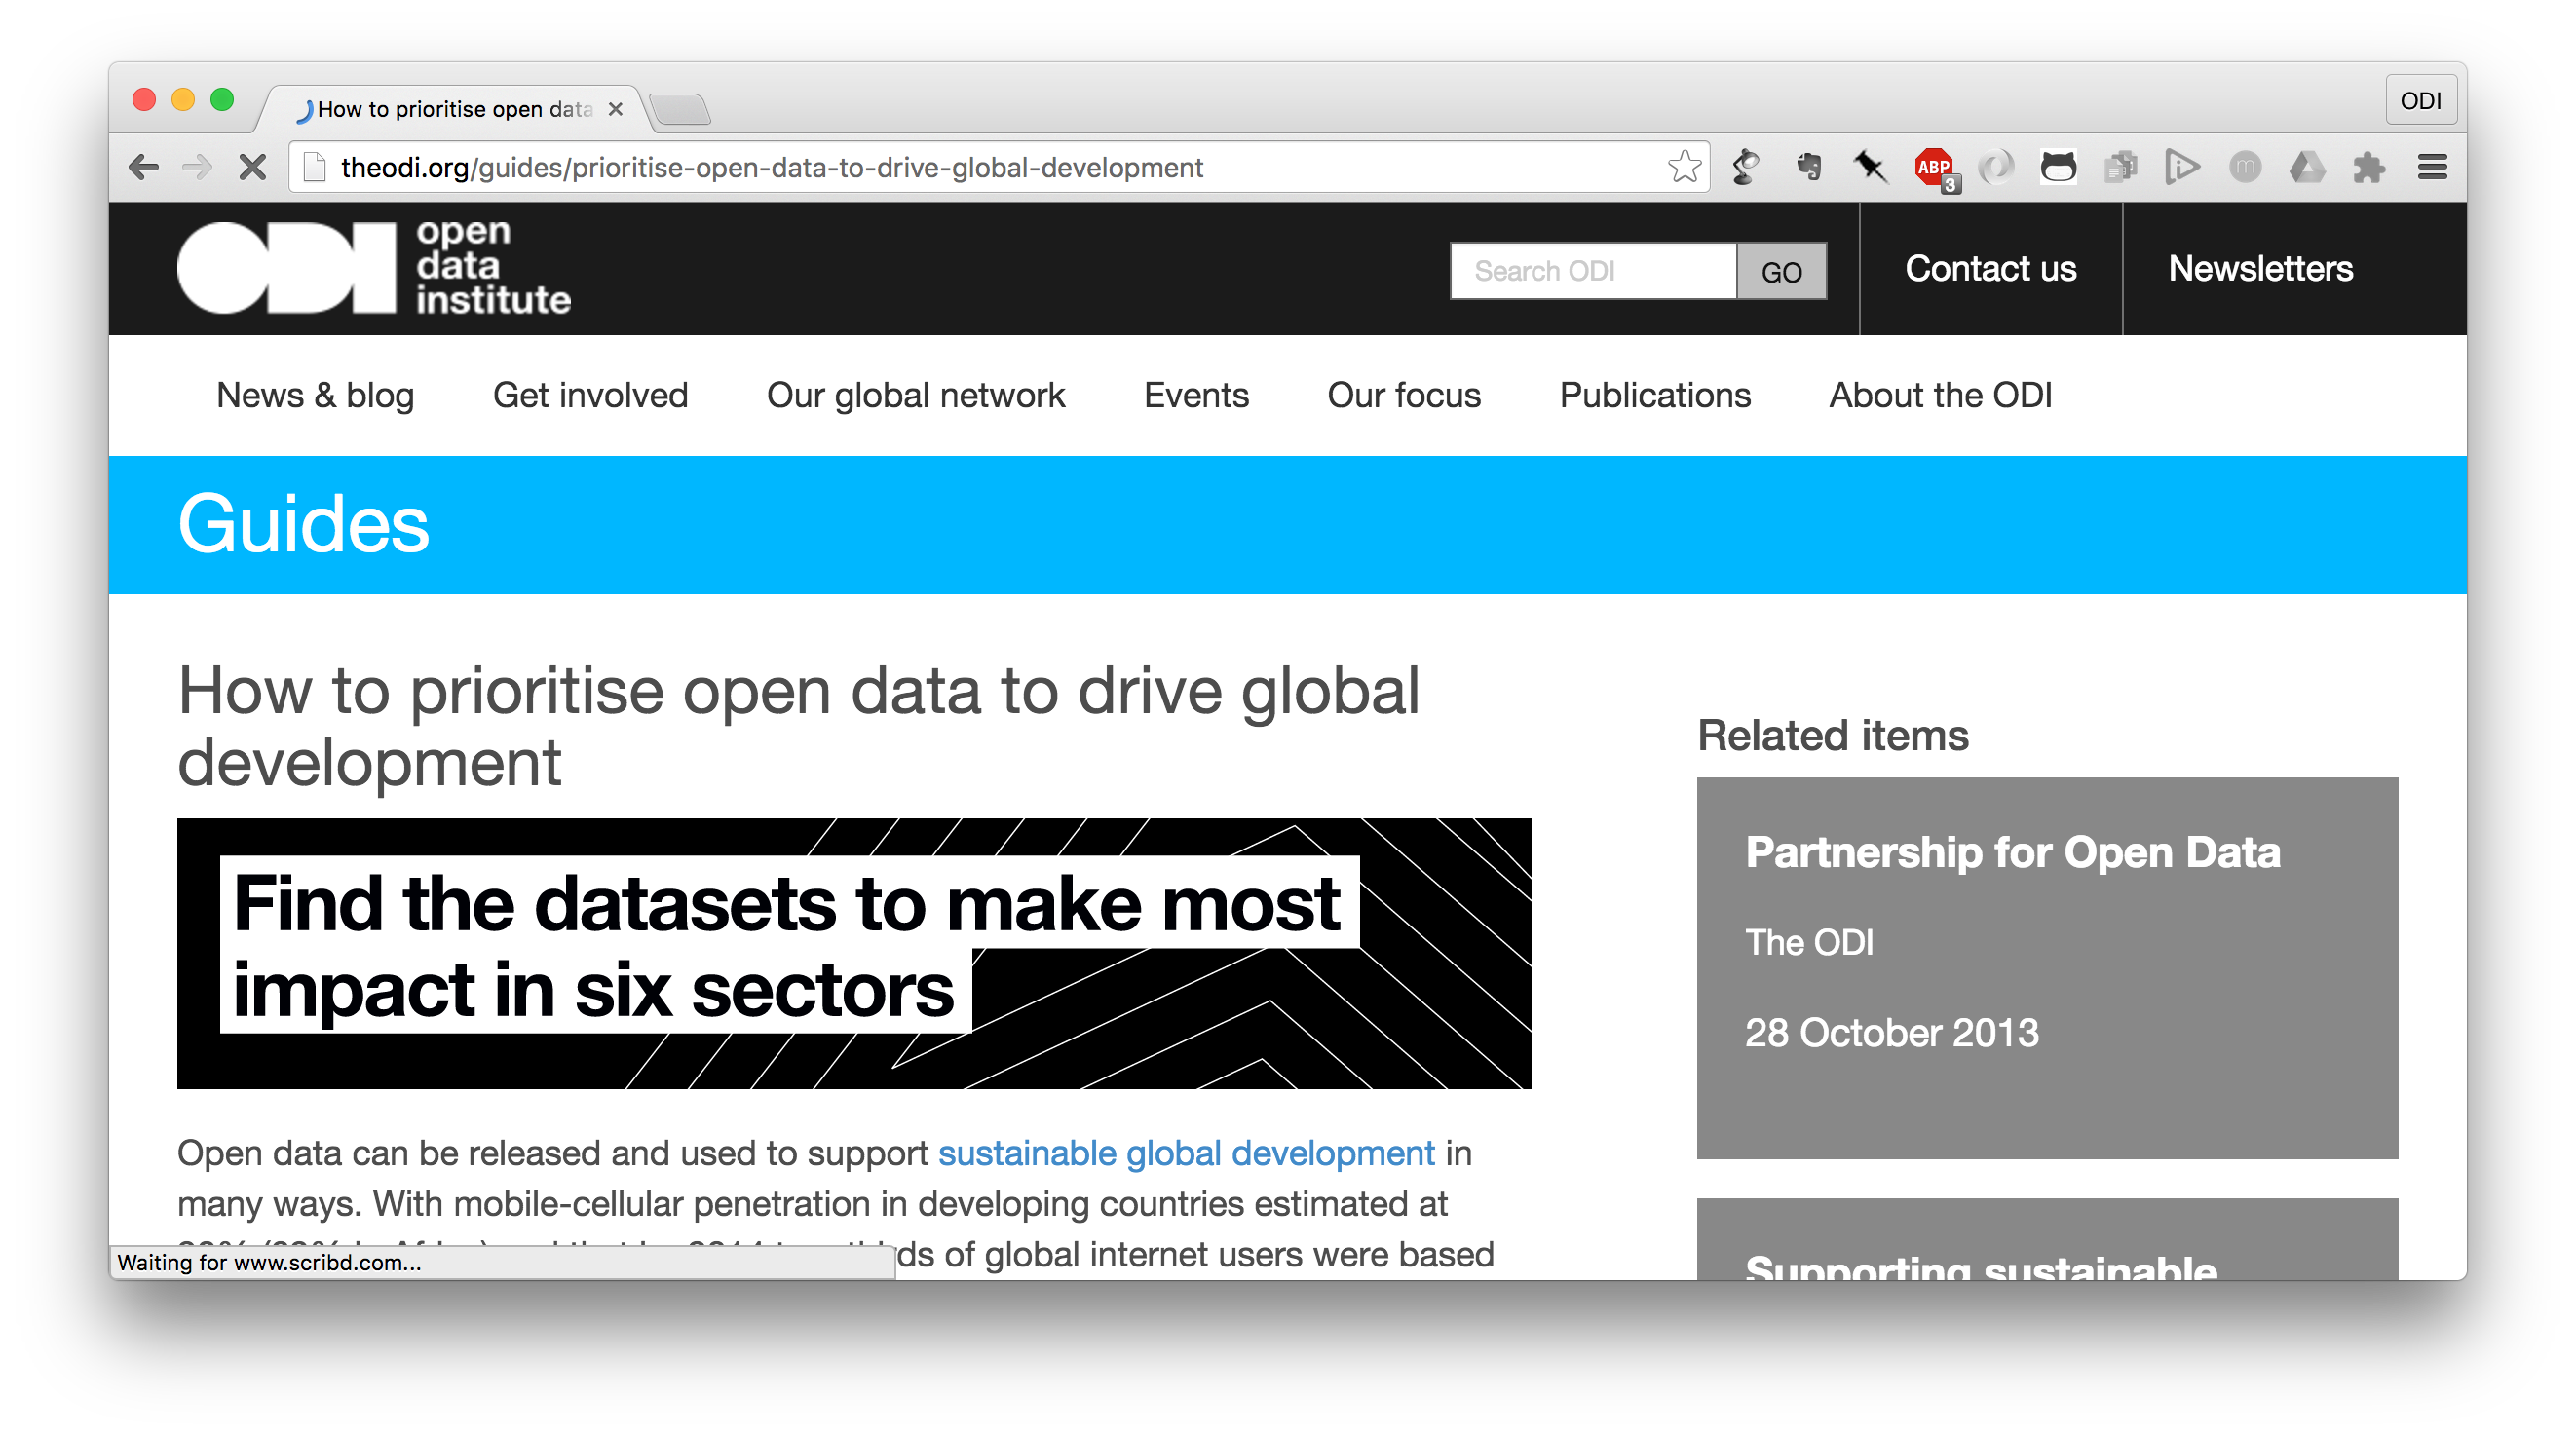
- How to prioritise open data to drive global development, a tool for global development
- The Anonymisation Decision-Making Framework, an online course
- Benchmarking open data automatically, a technical report
- The Open Rail Performance Index, a failed study
- Academic and technical stuff
- On data visualisation
- Some more random fun projects, with data
Show me the money, a data project
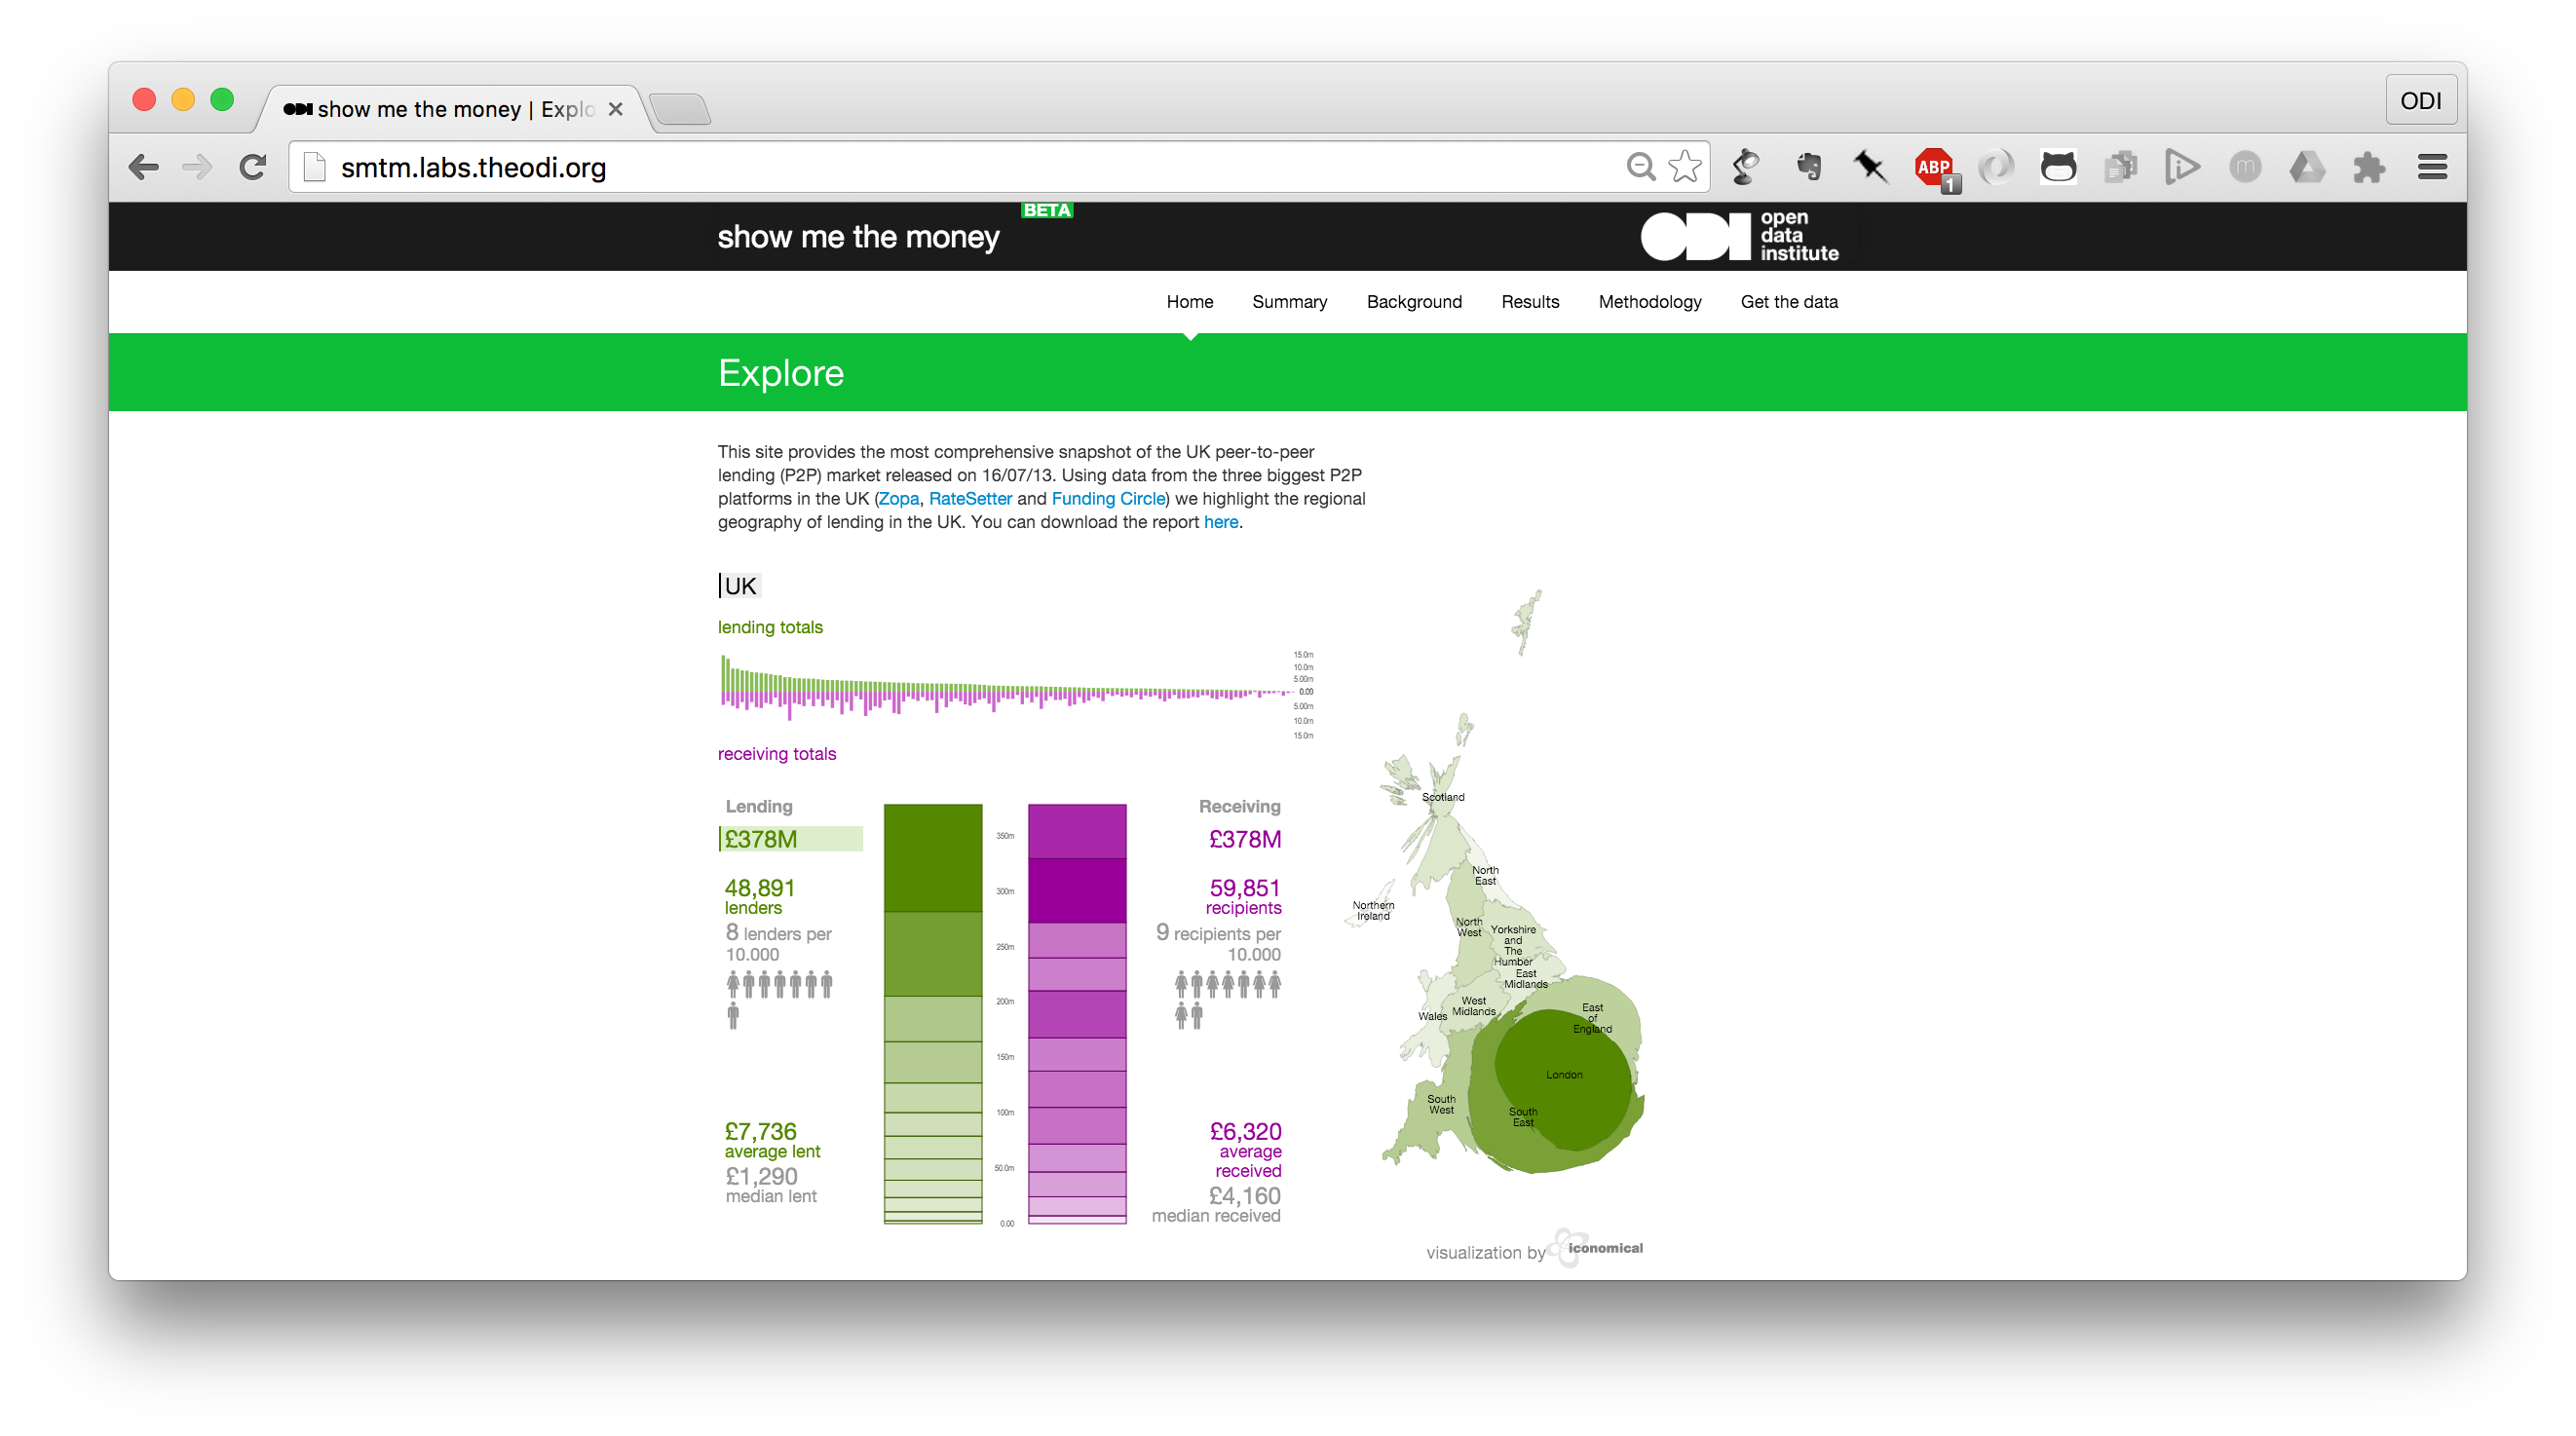
In Show me the money I analysed all existing transactions of the three biggest peer-to-peer (P2P) platforms in the UK: Zopa, RateSetter, and Funding Circle. The data contains almost 14 million loan parts. It provided the most comprehensive snapshot of the UK P2P market at the time of publication. We gained high-profile media coverage for this story and have direct evidence of change in the peer-to-peer sector. Nice cartogram!
2013, peer-to-peer, R, analysis, visualisation, project management
How open data can help shape the way we analyse electoral behaviour, another data project
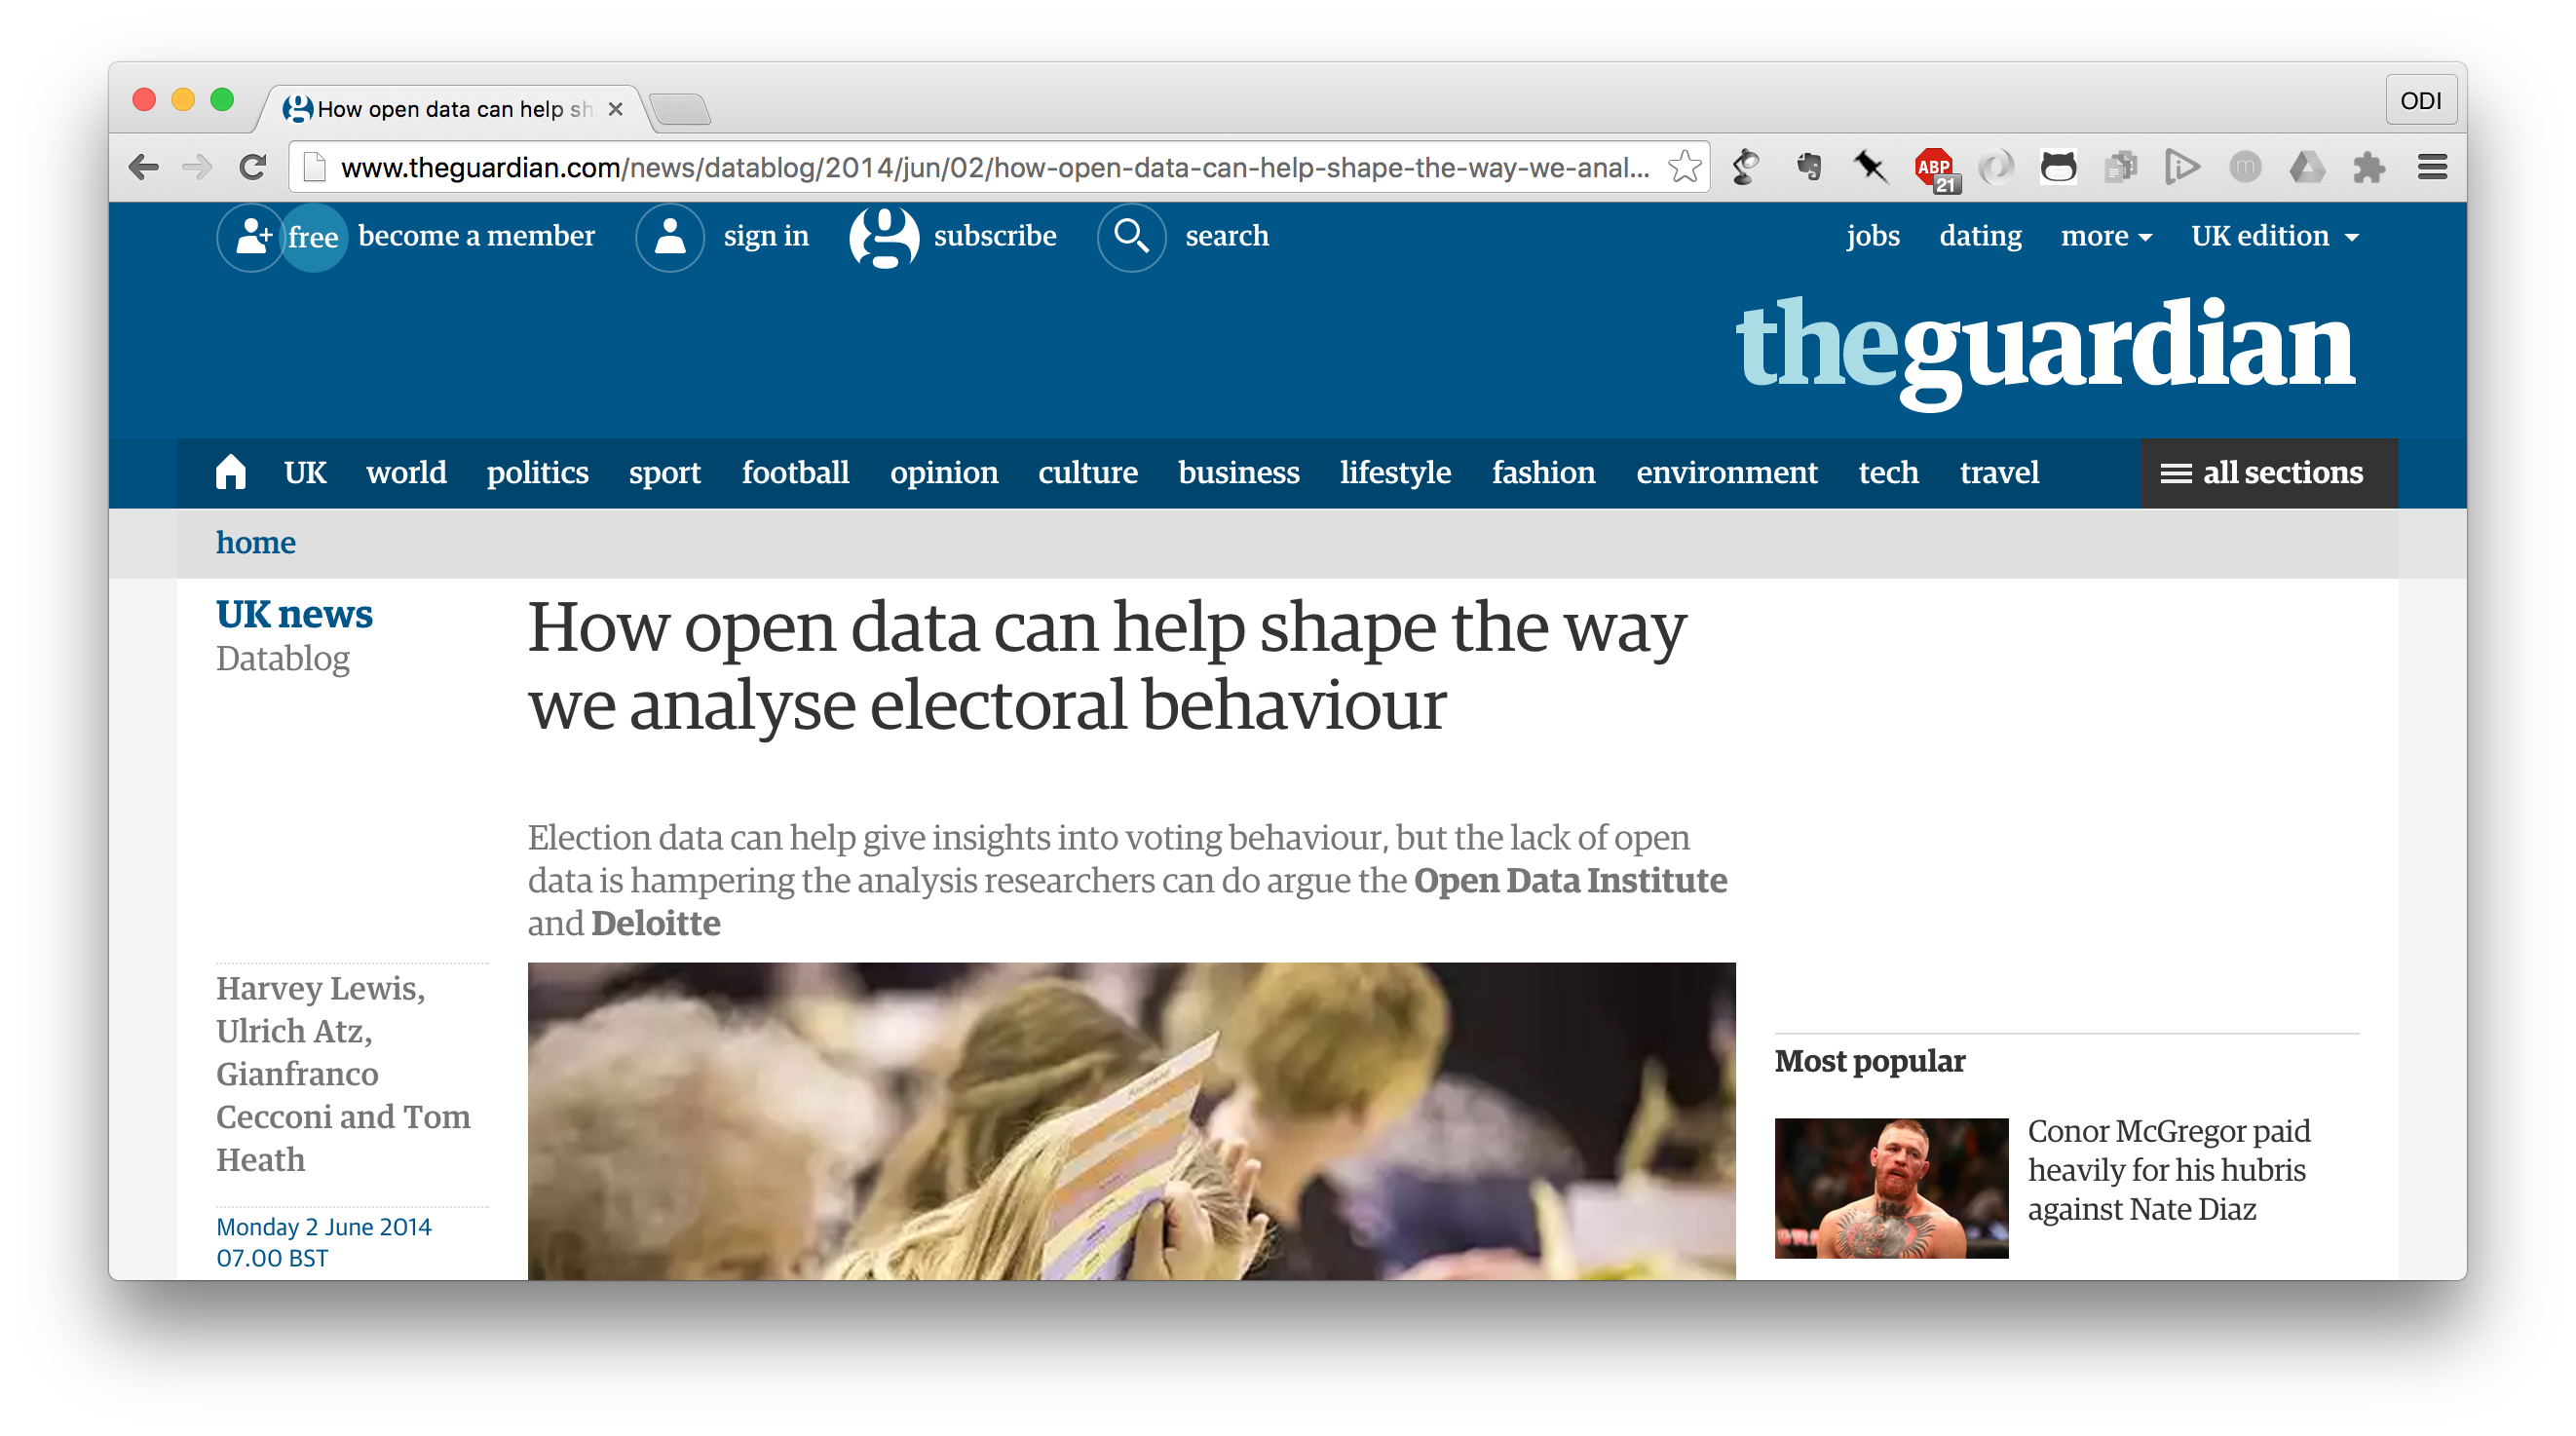
A joint project between Deloitte and the Open Data Institute on how election data can help give insights into voting behaviour. I enjoyed this project a lot, as it was interesting, a fast turn-around and I got to apply various models among them random forests.
2014, R, analysis, visualisation, elections
What is a CSV? A case study of CSVs on data.gov.uk, an elaborate blog post
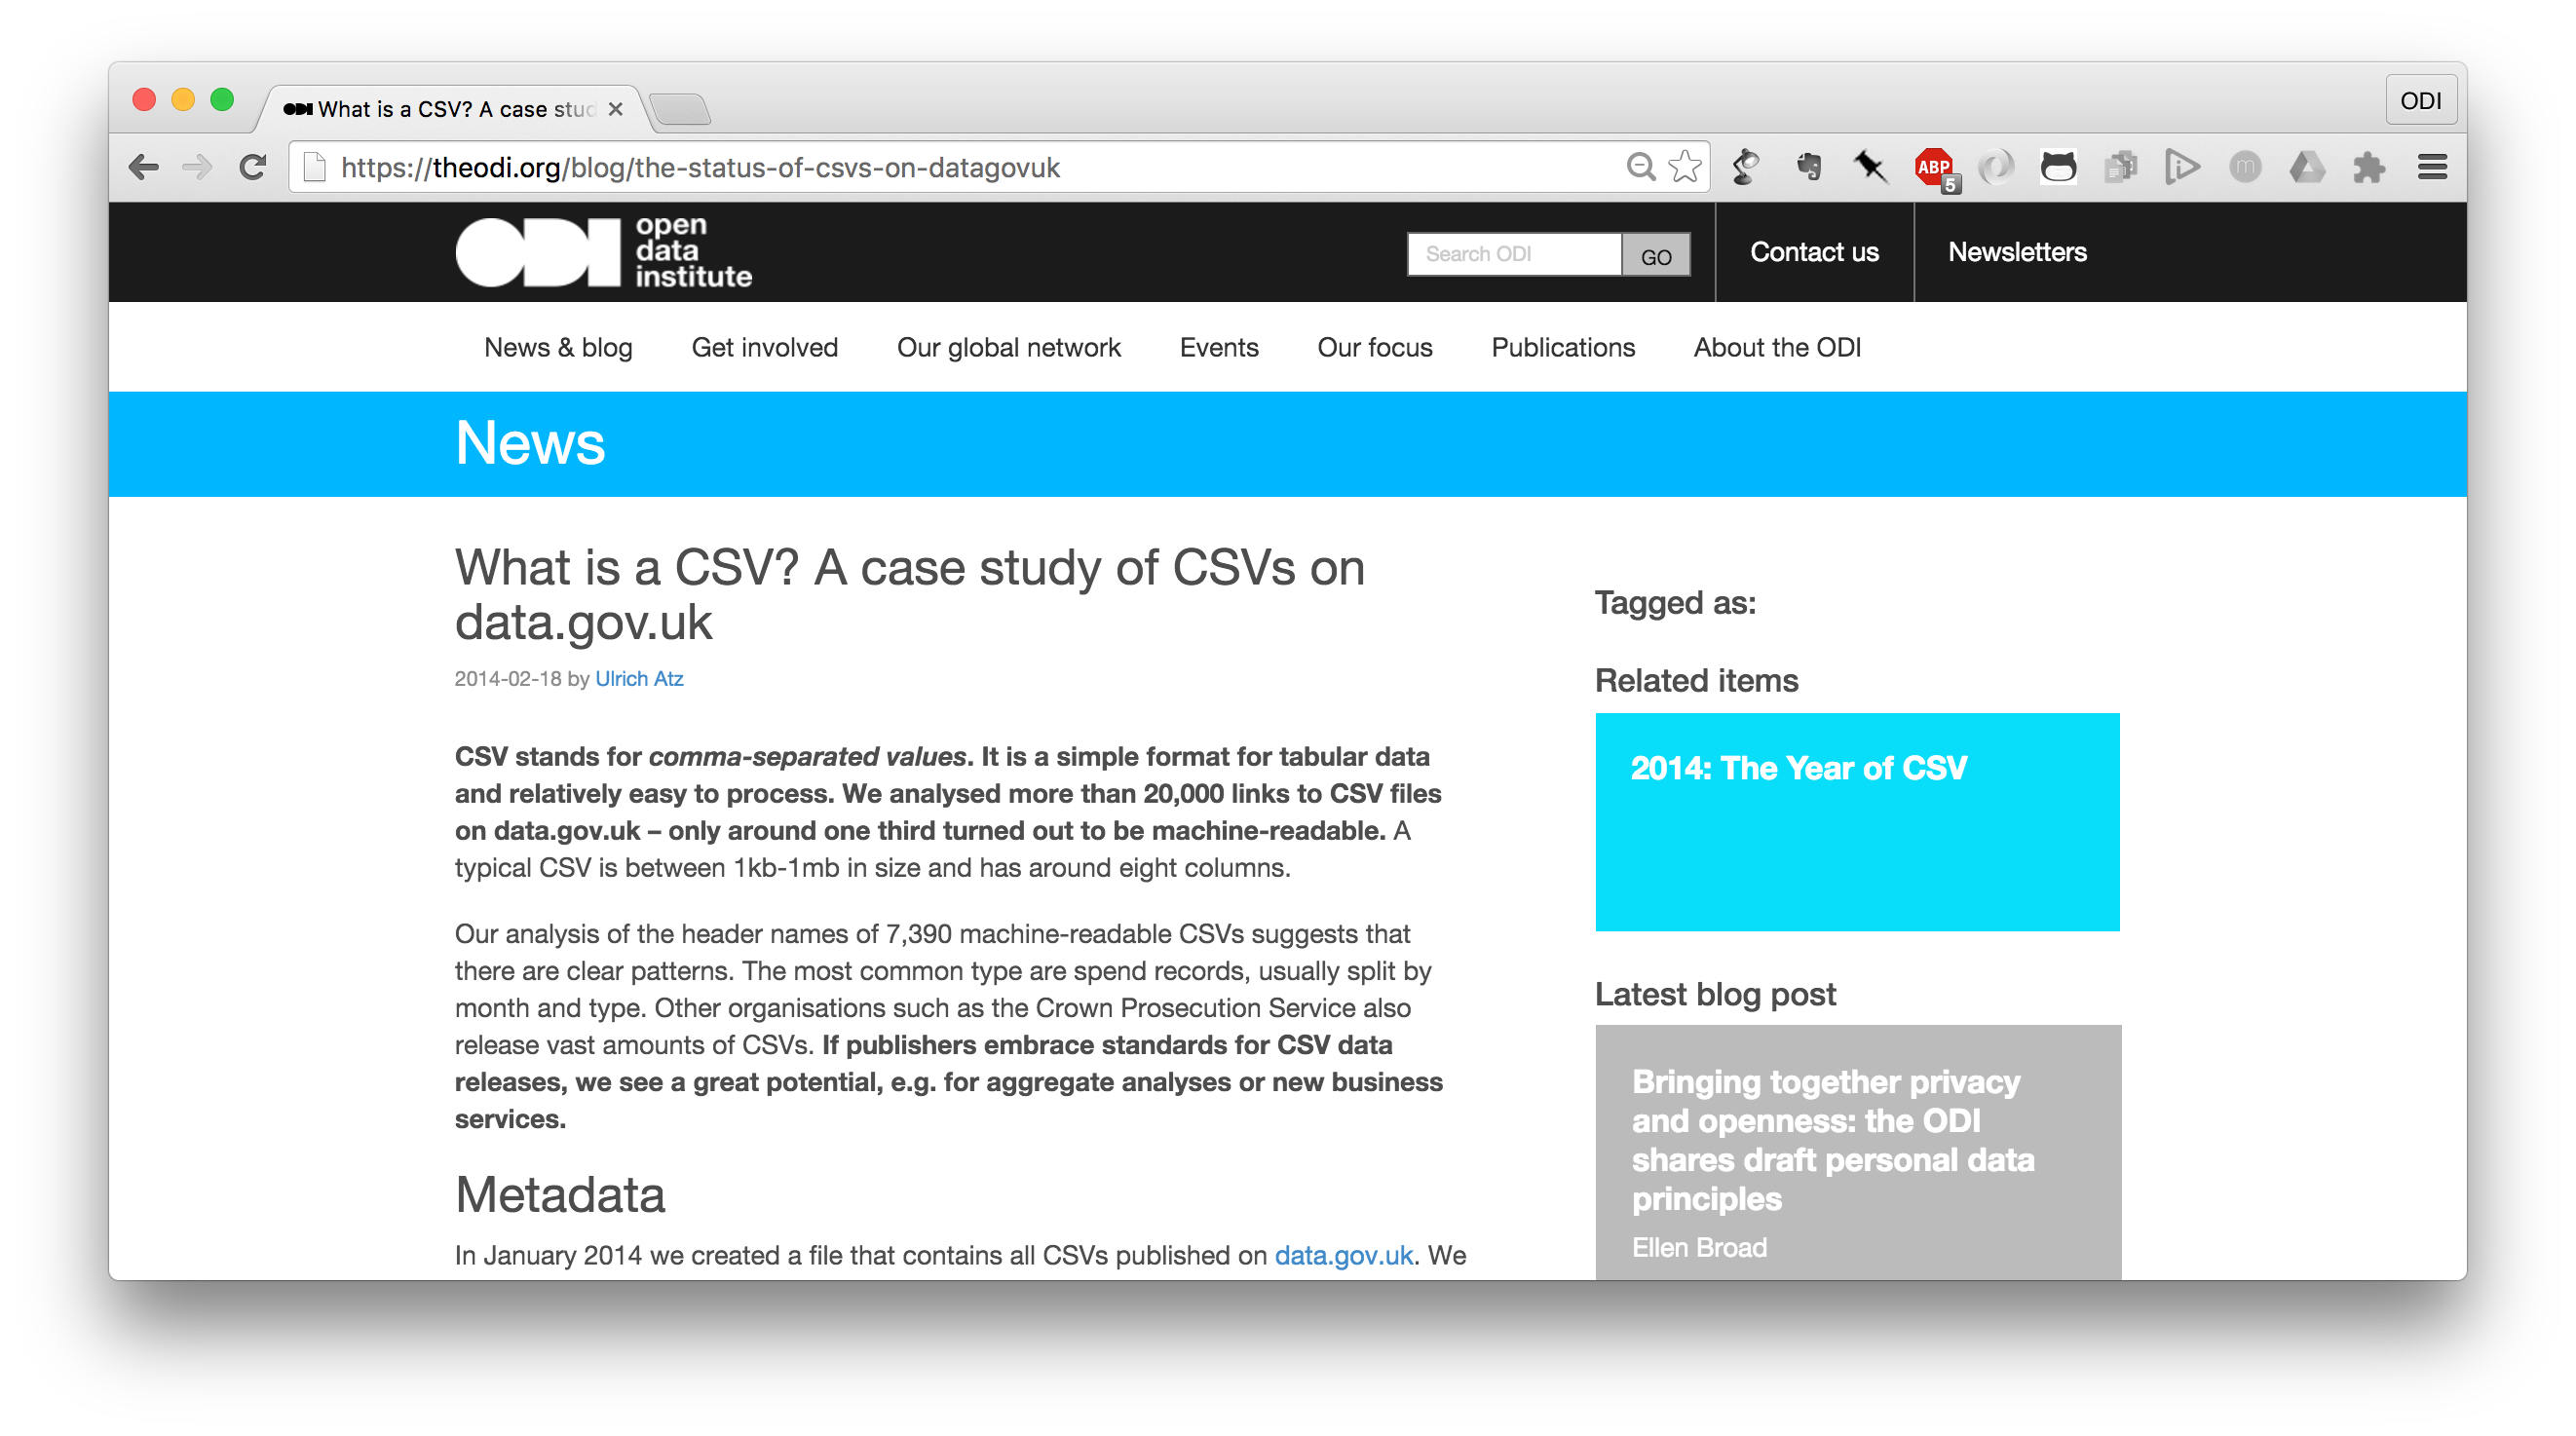
A short project during my time at the Open Data Institute, where I analysed more than 20,000 links to CSV files on data.gov.uk. Results: only around one third turned out to be machine-readable. A typical CSV is between 1kb-1mb in size and has around eight columns. And I got to play around with Gephi.
2014, R, analysis, CSV, study
A survey of the uses in quantified self, a survey and presentation
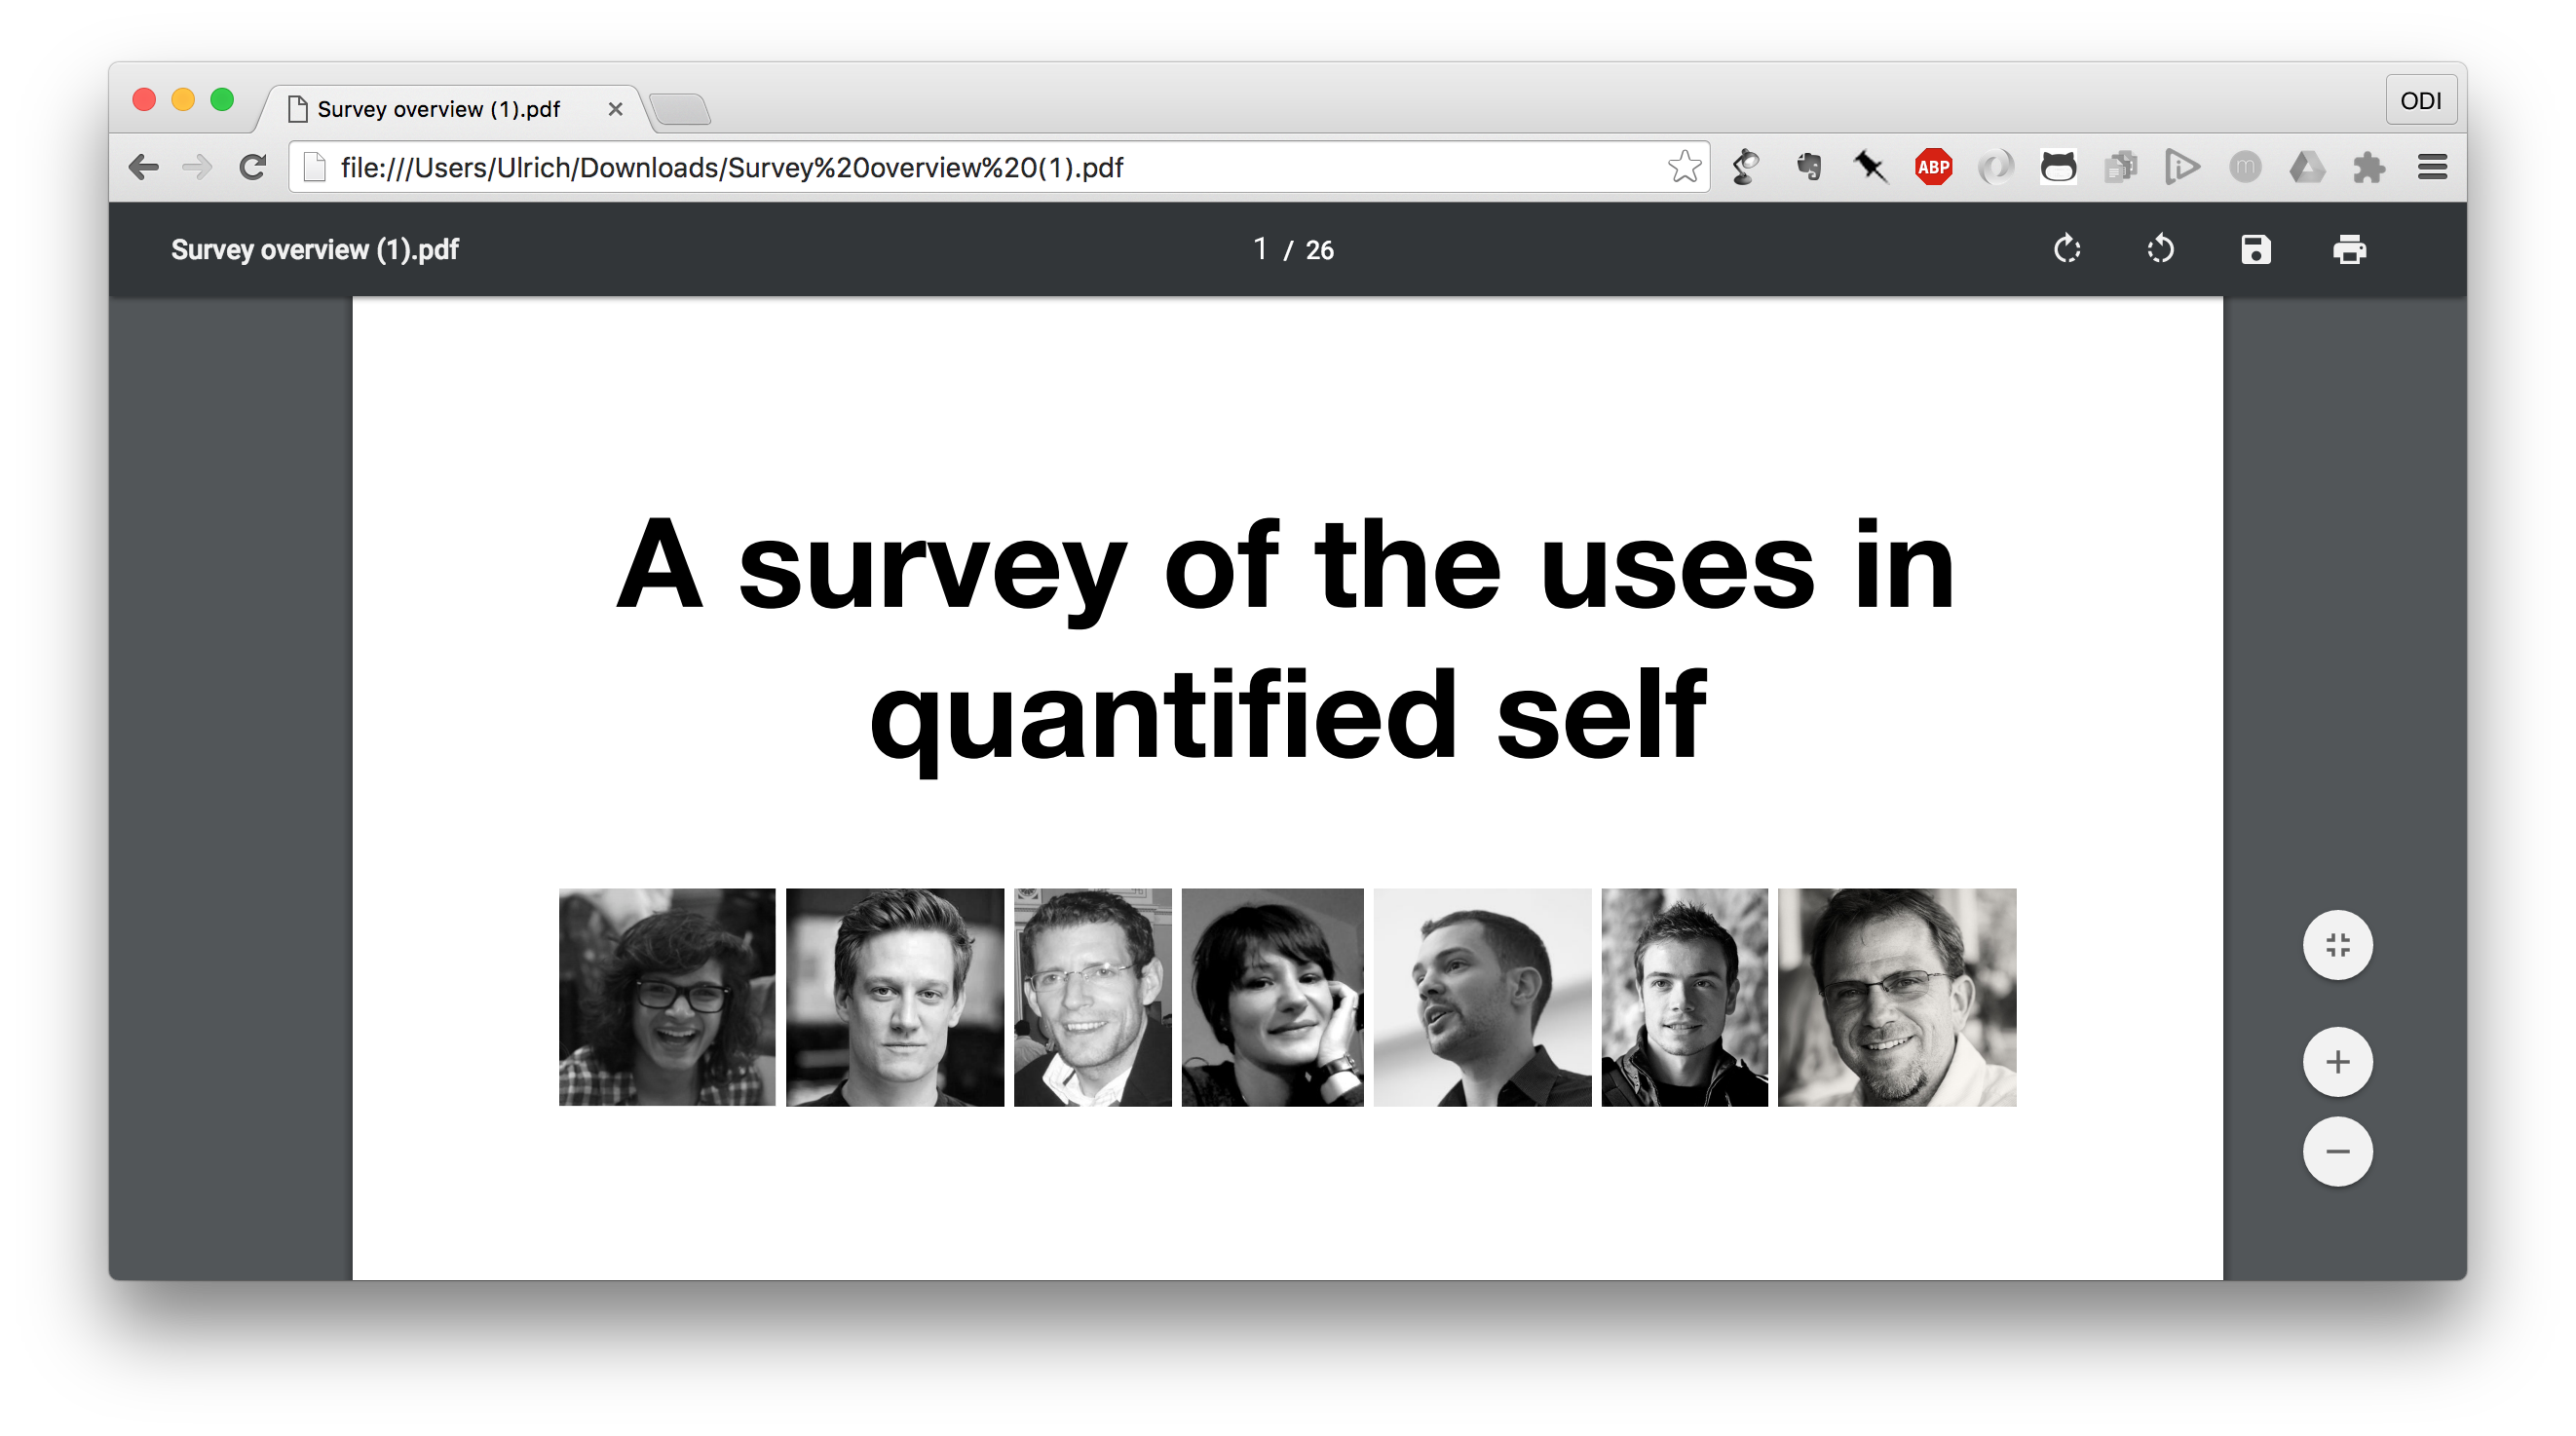
The presentation slides give a brief overview about the findings. For me it was interesting to play around with SPSS and R integration, that is variable labels. There’s also a nice integration with Google documents and R. I was particularly pleased when I reused code that was years old – and it worked.
2014, quantified self, R, analysis, survey, presentation
There is a lot more where this came from… Here is an example: a book chapter.
How to prioritise open data to drive global development, a tool for global development
I designed the methodology and enjoyed classifying case studies, applications, anecdata. For each sector, we mapped out relevant datasets and examples of real-world open data applications. We then offer three goal options to help decision- and policy-makers select datasets to release as open data.
2014, open data, report, spreadsheet, recommendation
The Anonymisation Decision-Making Framework, an online course
Together with the UK Anonymisation Network and Purple Guerrilla I’ve managed and developed an online course as an introduction to anonymisation. The online learning aims to promote the decision-making framework and give data practitioners confidence when dealing with personal data.
2015, anonymisation, governance, learning, project management, spreadsheet
Benchmarking open data automatically, a technical report
A high-level overview of if and how we can evaluate and rank countries, organisations and projects, based on how well they use open data in different ways. As open data becomes more widespread and useful, so does the need for effective ways to analyse it.
2014, open data, benchmarking, report, recommendations
The Open Rail Performance Index, a failed study
An example of a failed study because we never managed to publish the results. Not everything is always a success, and I hope others can related to this. The study was titled How the UK could gain up to £387 million per year and then it got political. The upshot: I learned a lot about R, the train industry and the value of travel time savings.
2014, open data, R, rail, benchmarking, report
Academic and technical stuff
- Making fast consensus clustering in R possible with speed improvements of x60. This is an extension for the R package
clusterCons. More information about the package can be found here. It has now been removed, so I’m not sure what’s going on. - Atz, U. (2014). The tau of data: A new metric to assess the timeliness of data in catalogues. In Conference for E-Democracy and Open Government (p. 257). Available online at http://project.opendatamonitor.eu/wp-content/uploads/dissemination/OpenDataMonitor_Publication_The-Tau-of-Data.pdf
- Atz, U. (2013). Evaluating experience sampling of stress in a single-subject research design. Personal and Ubiquitous Computing, 17(4), 639-652. Available online at http://ulrichatz.eu/docs/atz-2013-experience-sampling.pdf
- Enjoy the rabbit hole of econometrics in my Master’s thesis: Empirics in Biotechnology: How does public R&D support affect private R&D investments?
- A tiny collection of R scripts, but I am really proud of
row-sample, a function to make analysing a random subset easier.
On data visualisation
- An introduction to the history of visualisation and many examples. Sadly it’s hidden deep away on page 30 of an OpenDataMonitor report. I plan to make this more accessible in the future.
- I run an R course on visualisation, in particular
ggplot2. I think I’m not allowed to release the training material, so I err on the safe side. - A vain, self-referential visualisation of temperature levels of 10 000 days for my 10 000th day alive.
- SCHEME_TUFTE: Stata module to provide a Tufte-inspired graphics scheme
- Some templates to make SPSS charts look more appealing
Some more random fun projects, with data
- A tutorial on how to use R to access data on the web and a tutorial on how to import a HTML table into R. Actually, I find the visualisation part most interesting.
- Cleaning up the dataset from the annual statement on the Government Wine Cellar. Not a glamorous job but someone has to do it.
- When I jumped on the train to comment on Piketty’s Capital, I made some suggestions on how to make his charts better. For example, in the style of the Economist.
- I run around ten workshops on anonymisation called Save the Titanic based on this event. Trust me when I say I know the Titanic passenger data inside-out.
- And to conclude on a philosophical note: What Is Data? Exploring The Question That No One Asks
